


Saving for a home down payment has become a moving target. As rising home prices outstrip wage growth, the amount of time buyers may need to set aside enough money has changed sharply in many parts of the country. In some states, rising incomes have helped offset higher home values. In others, buyers may face a substantially longer path to ownership than they did just one decade ago.
SmartAsset analyzed typical home values in each state in 2016 and 2026 and compared them with median household income to estimate how many years of savings would be required to afford a 20% down payment, assuming households set aside 10% of annual income. The analysis also evaluates how long a minimum-wage earner would need to save for a down payment in 2026, based on each state's minimum wage. The estimate is a point-in-time affordability measure and does not model income growth or investment returns during the saving period. This approach allows for a consistent state-by-state comparison of how current home values and incomes affect the relative burden of saving for a down payment.
Key Findings
- Idaho had the largest increase in time needed to save for a down payment. Median-income households in the Gem State now need 11.2 years to save enough for a home, up three years and four months from 2016.
- Pricey coastal states still require the most time to save for a down payment. In three coastal states, median-income households need at least 12 years to save enough for a home: Hawai'i (15.6 years), California (14.7 years), and Massachusetts (12 years).
- West Virginia has the nation's lowest down payment burden. A median-income household there needs 5.5 years to save for a down payment in 2026, three months longer than in 2016.
- In three states, median-income households can save for a down payment faster than they could in 2016. In Mississippi, North Dakota, and Louisiana, income growth outpaced home-price growth. As a result, it now takes less time to save for a down payment in Mississippi (two months less), North Dakota (six months less), and Louisiana (17 months less).
- Saving for a down payment on a minimum-wage income alone is essentially impossible in every state. Even in Missouri, the most favorable state, a minimum-wage earner would need 17 years to save enough for a down payment on a home. In Utah, that timeline exceeds 70 years.
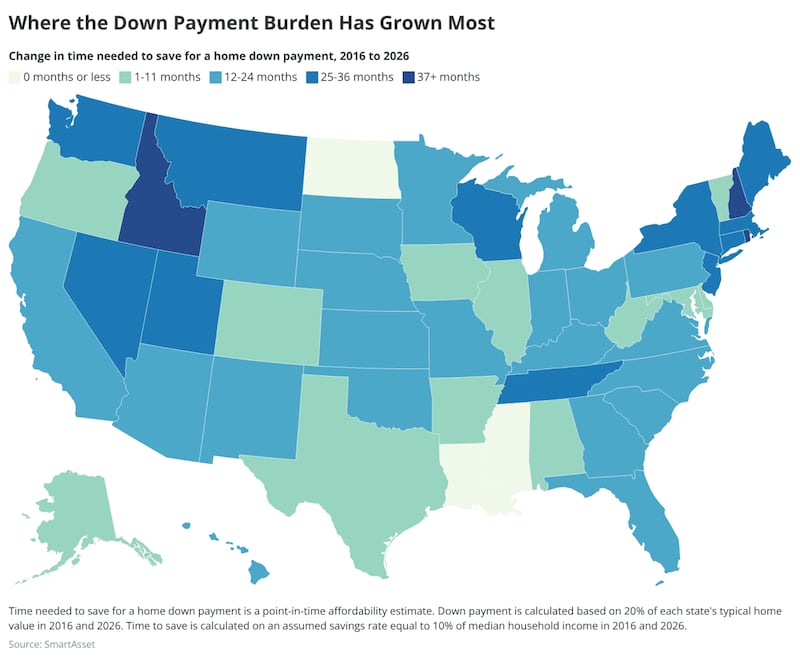
SmartAsset

SmartAsset
States Ranked by Change in Time Needed to Save for a Home Down Payment*
1. Idaho
April 2016 typical home value: $203,447
April 2026 typical home value: $477,506
Median household income
- 2016 median household income: $51,807
- 2026 median household income: $85,592
- Time needed to save at median household income (2026): 11.2 years
- Change in time needed to save (2016 to 2026): 40 months longer
Minimum wage
- 2026 annualized minimum wage: $15,080
- Time needed to save at annualized minimum wage (2026): 63.3 years
2. Rhode Island
April 2016 typical home value: $248,509
April 2026 typical home value: $504,793
Median household income
- 2016 median household income: $60,596
- 2026 median household income: $88,088
- Time needed to save at median household income (2026): 11.5 years
- Change in time needed to save (2016 to 2026): 39 months longer
Minimum wage
- 2026 annualized minimum wage: $33,280
- Time needed to save at annualized minimum wage (2026): 30.3 years
3. New Hampshire
April 2016 typical home value: $239,022
April 2026 typical home value: $510,709
Median household income
- 2016 median household income: $70,936
- 2026 median household income: $105,248
- Time needed to save at median household income (2026): 9.7 years
- Change in time needed to save (2016 to 2026): 36 months longer
Minimum wage
- 2026 annualized minimum wage: $15,080
- Time needed to save at annualized minimum wage (2026): 67.7 years
4. Maine
April 2016 typical home value: $195,978
April 2026 typical home value: $412,608
Median household income
- 2016 median household income: $53,079
- 2026 median household income: $80,600
- Time needed to save at median household income (2026): 10.2 years
- Change in time needed to save (2016 to 2026): 34 months longer
Minimum wage
- 2026 annualized minimum wage: $31,408
- Time needed to save at annualized minimum wage (2026): 26.3 years
5. Utah
April 2016 typical home value: $261,055
April 2026 typical home value: $540,993
Median household income
- 2016 median household income: $65,977
- 2026 median household income: $101,920
- Time needed to save at median household income (2026): 10.6 years
- Change in time needed to save (2016 to 2026): 32 months longer
Minimum wage
- 2026 annualized minimum wage: $15,080
- Time needed to save at annualized minimum wage (2026): 71.7 years
6. Montana
April 2016 typical home value: $227,136
April 2026 typical home value: $467,919
Median household income
- 2016 median household income: $50,027
- 2026 median household income: $79,456
- Time needed to save at median household income (2026): 11.8 years
- Change in time needed to save (2016 to 2026): 32 months longer
Minimum wage
- 2026 annualized minimum wage: $22,568
- Time needed to save at annualized minimum wage (2026): 41.5 years
7. Washington
April 2016 typical home value: $307,616
April 2026 typical home value: $604,087
Median household income
- 2016 median household income: $67,106
- 2026 median household income: $104,832
- Time needed to save at median household income (2026): 11.5 years
- Change in time needed to save (2016 to 2026): 28 months longer
Minimum wage
- 2026 annualized minimum wage: $35,630
- Time needed to save at annualized minimum wage (2026): 33.9 years
8. New Jersey
April 2016 typical home value: $309,556
April 2026 typical home value: $571,373
Median household income
- 2016 median household income: $76,126
- 2026 median household income: $109,980
- Time needed to save at median household income (2026): 10.4 years
- Change in time needed to save (2016 to 2026): 27 months longer
Minimum wage
- 2026 annualized minimum wage: $31,678
- Time needed to save at annualized minimum wage (2026): 36.1 years
9. New York
April 2016 typical home value: $283,872
April 2026 typical home value: $510,449
Median household income
- 2016 median household income: $62,909
- 2026 median household income: $90,532
- Time needed to save at median household income (2026): 11.3 years
- Change in time needed to save (2016 to 2026): 27 months longer
Minimum wage
- 2026 annualized minimum wage: $33,280
- Time needed to save at annualized minimum wage (2026): 30.7 years
10. Massachusetts
April 2016 typical home value: $366,592
April 2026 typical home value: $661,755
Median household income
- 2016 median household income: $75,297
- 2026 median household income: $110,552
- Time needed to save at median household income (2026): 12 years
- Change in time needed to save (2016 to 2026): 27 months longer
Minimum wage
- 2026 annualized minimum wage: $31,200
- Time needed to save at annualized minimum wage (2026): 42.4 years
11. Nevada
April 2016 typical home value: $227,181
April 2026 typical home value: $447,225
Median household income
- 2016 median household income: $55,180
- 2026 median household income: $85,592
- Time needed to save at median household income (2026): 10.5 years
- Change in time needed to save (2016 to 2026): 27 months longer
Minimum wage
- 2026 annualized minimum wage: $24,960
- Time needed to save at annualized minimum wage (2026): 35.8 years
12. Wisconsin
April 2016 typical home value: $170,732
April 2026 typical home value: $333,909
Median household income
- 2016 median household income: $56,811
- 2026 median household income: $81,744
- Time needed to save at median household income (2026): 8.2 years
- Change in time needed to save (2016 to 2026): 26 months longer
Minimum wage
- 2026 annualized minimum wage: $15,080
- Time needed to save at annualized minimum wage (2026): 44.3 years
13. Connecticut
April 2016 typical home value: $243,732
April 2026 typical home value: $441,466
Median household income
- 2016 median household income: $73,433
- 2026 median household income: $101,296
- Time needed to save at median household income (2026): 8.7 years
- Change in time needed to save (2016 to 2026): 25 months longer
Minimum wage
- 2026 annualized minimum wage: $35,235
- Time needed to save at annualized minimum wage (2026): 25.1 years
14. Tennessee
April 2016 typical home value: $163,763
April 2026 typical home value: $334,075
Median household income
- 2016 median household income: $48,547
- 2026 median household income: $75,920
- Time needed to save at median household income (2026): 8.8 years
- Change in time needed to save (2016 to 2026): 25 months longer
Minimum wage
- 2026 annualized minimum wage: $15,080
- Time needed to save at annualized minimum wage (2026): 44.3 years
15. North Carolina
April 2016 typical home value: $171,688
April 2026 typical home value: $337,273
Median household income
- 2016 median household income: $50,584
- 2026 median household income: $78,000
- Time needed to save at median household income (2026): 8.6 years
- Change in time needed to save (2016 to 2026): 22 months longer
Minimum wage
- 2026 annualized minimum wage: $15,080
- Time needed to save at annualized minimum wage (2026): 44.7 years
16. Indiana
April 2016 typical home value: $128,398
April 2026 typical home value: $256,584
Median household income
- 2016 median household income: $52,314
- 2026 median household income: $75,868
- Time needed to save at median household income (2026): 6.8 years
- Change in time needed to save (2016 to 2026): 22 months longer
Minimum wage
- 2026 annualized minimum wage: $15,080
- Time needed to save at annualized minimum wage (2026): 34 years
17. Michigan
April 2016 typical home value: $136,024
April 2026 typical home value: $263,590
Median household income
- 2016 median household income: $52,491
- 2026 median household income: $76,336
- Time needed to save at median household income (2026): 6.9 years
- Change in time needed to save (2016 to 2026): 21 months longer
Minimum wage
- 2026 annualized minimum wage: $28,558
- Time needed to save at annualized minimum wage (2026): 18.5 years
18. Georgia
April 2016 typical home value: $166,473
April 2026 typical home value: $333,559
Median household income
- 2016 median household income: $53,559
- 2026 median household income: $84,344
- Time needed to save at median household income (2026): 7.9 years
- Change in time needed to save (2016 to 2026): 20 months longer
Minimum wage
- 2026 annualized minimum wage: $15,080
- Time needed to save at annualized minimum wage (2026): 44.2 years
19. Arizona
April 2016 typical home value: $219,358
April 2026 typical home value: $423,746
Median household income
- 2016 median household income: $53,558
- 2026 median household income: $85,956
- Time needed to save at median household income (2026): 9.9 years
- Change in time needed to save (2016 to 2026): 20 months longer
Minimum wage
- 2026 annualized minimum wage: $31,512
- Time needed to save at annualized minimum wage (2026): 26.9 years
20. Nebraska
April 2016 typical home value: $151,338
April 2026 typical home value: $279,080
Median household income
- 2016 median household income: $56,927
- 2026 median household income: $80,548
- Time needed to save at median household income (2026): 6.9 years
- Change in time needed to save (2016 to 2026): 19 months longer
Minimum wage
- 2026 annualized minimum wage: $31,200
- Time needed to save at annualized minimum wage (2026): 17.9 years
21. Ohio
April 2016 typical home value: $127,813
April 2026 typical home value: $244,844
Median household income
- 2016 median household income: $52,344
- 2026 median household income: $76,180
- Time needed to save at median household income (2026): 6.4 years
- Change in time needed to save (2016 to 2026): 19 months longer
Minimum wage
- 2026 annualized minimum wage: $15,080
- Time needed to save at annualized minimum wage (2026): 32.5 years
22. California
April 2016 typical home value: $446,711
April 2026 typical home value: $776,233
Median household income
- 2016 median household income: $67,739
- 2026 median household income: $105,612
- Time needed to save at median household income (2026): 14.7 years
- Change in time needed to save (2016 to 2026): 18 months longer
Minimum wage
- 2026 annualized minimum wage: $35,152
- Time needed to save at annualized minimum wage (2026): 44.2 years
23. Missouri
April 2016 typical home value: $142,907
April 2026 typical home value: $265,398
Median household income
- 2016 median household income: $51,746
- 2026 median household income: $75,504
- Time needed to save at median household income (2026): 7 years
- Change in time needed to save (2016 to 2026): 18 months longer
Minimum wage
- 2026 annualized minimum wage: $31,200
- Time needed to save at annualized minimum wage (2026): 17 years
24. Kentucky
April 2016 typical home value: $125,569
April 2026 typical home value: $232,231
Median household income
- 2016 median household income: $46,659
- 2026 median household income: $68,068
- Time needed to save at median household income (2026): 6.8 years
- Change in time needed to save (2016 to 2026): 17 months longer
Minimum wage
- 2026 annualized minimum wage: $15,080
- Time needed to save at annualized minimum wage (2026): 30.8 years
25. Florida
April 2016 typical home value: $196,979
April 2026 typical home value: $376,504
Median household income
- 2016 median household income: $50,860
- 2026 median household income: $82,004
- Time needed to save at median household income (2026): 9.2 years
- Change in time needed to save (2016 to 2026): 17 months longer
Minimum wage
- 2026 annualized minimum wage: $29,120
- Time needed to save at annualized minimum wage (2026): 25.9 years
26. New Mexico
April 2016 typical home value: $174,734
April 2026 typical home value: $317,474
Median household income
- 2016 median household income: $46,748
- 2026 median household income: $71,500
- Time needed to save at median household income (2026): 8.9 years
- Change in time needed to save (2016 to 2026): 17 months longer
Minimum wage
- 2026 annualized minimum wage: $24,960
- Time needed to save at annualized minimum wage (2026): 25.4 years
27. Wyoming
April 2016 typical home value: $232,073
April 2026 typical home value: $363,685
Median household income
- 2016 median household income: $59,882
- 2026 median household income: $79,664
- Time needed to save at median household income (2026): 9.1 years
- Change in time needed to save (2016 to 2026): 17 months longer
Minimum wage
- 2026 annualized minimum wage: $15,080
- Time needed to save at annualized minimum wage (2026): 48.2 years
28. South Carolina
April 2016 typical home value: $163,923
April 2026 typical home value: $305,174
Median household income
- 2016 median household income: $49,501
- 2026 median household income: $76,284
- Time needed to save at median household income (2026): 8 years
- Change in time needed to save (2016 to 2026): 17 months longer
Minimum wage
- 2026 annualized minimum wage: $15,080
- Time needed to save at annualized minimum wage (2026): 40.5 years
29. South Dakota
April 2016 typical home value: $178,715
April 2026 typical home value: $319,255
Median household income
- 2016 median household income: $54,467
- 2026 median household income: $81,068
- Time needed to save at median household income (2026): 7.9 years
- Change in time needed to save (2016 to 2026): 16 months longer
Minimum wage
- 2026 annualized minimum wage: $24,648
- Time needed to save at annualized minimum wage (2026): 25.9 years
30. Hawai‘i
April 2016 typical home value: $533,475
April 2026 typical home value: $830,219
Median household income
- 2016 median household income: $74,511
- 2026 median household income: $106,236
- Time needed to save at median household income (2026): 15.6 years
- Change in time needed to save (2016 to 2026): 16 months longer
Minimum wage
- 2026 annualized minimum wage: $33,280
- Time needed to save at annualized minimum wage (2026): 49.9 years
31. Kansas
April 2016 typical home value: $134,162
April 2026 typical home value: $246,369
Median household income
- 2016 median household income: $54,935
- 2026 median household income: $79,664
- Time needed to save at median household income (2026): 6.2 years
- Change in time needed to save (2016 to 2026): 16 months longer
Minimum wage
- 2026 annualized minimum wage: $15,080
- Time needed to save at annualized minimum wage (2026): 32.7 years
32. Minnesota
April 2016 typical home value: $208,251
April 2026 typical home value: $350,891
Median household income
- 2016 median household income: $65,599
- 2026 median household income: $91,884
- Time needed to save at median household income (2026): 7.6 years
- Change in time needed to save (2016 to 2026): 15 months longer
Minimum wage
- 2026 annualized minimum wage: $23,733
- Time needed to save at annualized minimum wage (2026): 29.6 years
33. Virginia
April 2016 typical home value: $248,601
April 2026 typical home value: $414,320
Median household income
- 2016 median household income: $68,114
- 2026 median household income: $97,136
- Time needed to save at median household income (2026): 8.5 years
- Change in time needed to save (2016 to 2026): 15 months longer
Minimum wage
- 2026 annualized minimum wage: $26,562
- Time needed to save at annualized minimum wage (2026): 31.2 years
34. Oklahoma
April 2016 typical home value: $126,963
April 2026 typical home value: $221,765
Median household income
- 2016 median household income: $49,176
- 2026 median household income: $69,784
- Time needed to save at median household income (2026): 6.4 years
- Change in time needed to save (2016 to 2026): 14 months longer
Minimum wage
- 2026 annualized minimum wage: $15,080
- Time needed to save at annualized minimum wage (2026): 29.4 years
35. Pennsylvania
April 2016 typical home value: $167,302
April 2026 typical home value: $286,387
Median household income
- 2016 median household income: $56,907
- 2026 median household income: $81,796
- Time needed to save at median household income (2026): 7 years
- Change in time needed to save (2016 to 2026): 13 months longer
Minimum wage
- 2026 annualized minimum wage: $15,080
- Time needed to save at annualized minimum wage (2026): 38 years
36. Oregon
April 2016 typical home value: $291,792
April 2026 typical home value: $501,661
Median household income
- 2016 median household income: $57,532
- 2026 median household income: $89,856
- Time needed to save at median household income (2026): 11.2 years
- Change in time needed to save (2016 to 2026): 12 months longer
Minimum wage
- 2026 annualized minimum wage: $29,224
- Time needed to save at annualized minimum wage (2026): 34.3 years
37. Vermont
April 2016 typical home value: $232,440
April 2026 typical home value: $394,227
Median household income
- 2016 median household income: $57,677
- 2026 median household income: $87,256
- Time needed to save at median household income (2026): 9 years
- Change in time needed to save (2016 to 2026): 12 months longer
Minimum wage
- 2026 annualized minimum wage: $29,994
- Time needed to save at annualized minimum wage (2026): 26.3 years
38. Illinois
April 2016 typical home value: $173,121
April 2026 typical home value: $290,210
Median household income
- 2016 median household income: $60,960
- 2026 median household income: $87,776
- Time needed to save at median household income (2026): 6.6 years
- Change in time needed to save (2016 to 2026): 11 months longer
Minimum wage
- 2026 annualized minimum wage: $31,200
- Time needed to save at annualized minimum wage (2026): 18.6 years
39. Iowa
April 2016 typical home value: $141,866
April 2026 typical home value: $234,891
Median household income
- 2016 median household income: $56,247
- 2026 median household income: $79,612
- Time needed to save at median household income (2026): 5.9 years
- Change in time needed to save (2016 to 2026): 10 months longer
Minimum wage
- 2026 annualized minimum wage: $15,080
- Time needed to save at annualized minimum wage (2026): 31.2 years
40. Colorado
April 2016 typical home value: $321,332
April 2026 typical home value: $543,271
Median household income
- 2016 median household income: $65,685
- 2026 median household income: $102,440
- Time needed to save at median household income (2026): 10.6 years
- Change in time needed to save (2016 to 2026): 10 months longer
Minimum wage
- 2026 annualized minimum wage: $31,533
- Time needed to save at annualized minimum wage (2026): 34.5 years
41. Texas
April 2016 typical home value: $181,155
April 2026 typical home value: $302,187
Median household income
- 2016 median household income: $56,565
- 2026 median household income: $84,084
- Time needed to save at median household income (2026): 7.2 years
- Change in time needed to save (2016 to 2026): 9 months longer
Minimum wage
- 2026 annualized minimum wage: $15,080
- Time needed to save at annualized minimum wage (2026): 40.1 years
42. Delaware
April 2016 typical home value: $248,044
April 2026 typical home value: $405,836
Median household income
- 2016 median household income: $61,757
- 2026 median household income: $92,300
- Time needed to save at median household income (2026): 8.8 years
- Change in time needed to save (2016 to 2026): 9 months longer
Minimum wage
- 2026 annualized minimum wage: $31,200
- Time needed to save at annualized minimum wage (2026): 26 years
43. Maryland
April 2016 typical home value: $284,871
April 2026 typical home value: $431,934
Median household income
- 2016 median household income: $78,945
- 2026 median household income: $108,524
- Time needed to save at median household income (2026): 8 years
- Change in time needed to save (2016 to 2026): 9 months longer
Minimum wage
- 2026 annualized minimum wage: $31,200
- Time needed to save at annualized minimum wage (2026): 27.7 years
44. Arkansas
April 2016 typical home value: $134,157
April 2026 typical home value: $222,300
Median household income
- 2016 median household income: $44,334
- 2026 median household income: $65,520
- Time needed to save at median household income (2026): 6.8 years
- Change in time needed to save (2016 to 2026): 9 months longer
Minimum wage
- 2026 annualized minimum wage: $22,880
- Time needed to save at annualized minimum wage (2026): 19.4 years
45. Alabama
April 2016 typical home value: $141,213
April 2026 typical home value: $236,705
Median household income
- 2016 median household income: $46,257
- 2026 median household income: $70,304
- Time needed to save at median household income (2026): 6.7 years
- Change in time needed to save (2016 to 2026): 8 months longer
Minimum wage
- 2026 annualized minimum wage: $15,080
- Time needed to save at annualized minimum wage (2026): 31.4 years
46. Alaska
April 2016 typical home value: $280,295
April 2026 typical home value: $390,107
Median household income
- 2016 median household income: $76,440
- 2026 median household income: $100,880
- Time needed to save at median household income (2026): 7.7 years
- Change in time needed to save (2016 to 2026): 5 months longer
Minimum wage
- 2026 annualized minimum wage: $27,040
- Time needed to save at annualized minimum wage (2026): 28.9 years
47. West Virginia
April 2016 typical home value: $112,167
April 2026 typical home value: $174,876
Median household income
- 2016 median household income: $43,385
- 2026 median household income: $64,116
- Time needed to save at median household income (2026): 5.5 years
- Change in time needed to save (2016 to 2026): 3 months longer
Minimum wage
- 2026 annualized minimum wage: $18,200
- Time needed to save at annualized minimum wage (2026): 19.2 years
48. Mississippi
April 2016 typical home value: $133,508
April 2026 typical home value: $194,242
Median household income
- 2016 median household income: $41,754
- 2026 median household income: $62,348
- Time needed to save at median household income (2026): 6.2 years
- Change in time needed to save (2016 to 2026): 2 months less
Minimum wage
- 2026 annualized minimum wage: $15,080
- Time needed to save at annualized minimum wage (2026): 25.8 years
49. North Dakota
April 2016 typical home value: $227,816
April 2026 typical home value: $286,406
Median household income
- 2016 median household income: $60,656
- 2026 median household income: $82,108
- Time needed to save at median household income (2026): 7 years
- Change in time needed to save (2016 to 2026): 6 months less
Minimum wage
- 2026 annualized minimum wage: $15,080
- Time needed to save at annualized minimum wage (2026): 38 years
50. Louisiana
April 2016 typical home value: $183,116
April 2026 typical home value: $214,727
Median household income
- 2016 median household income: $45,146
- 2026 median household income: $64,324
- Time needed to save at median household income (2026): 6.7 years
- Change in time needed to save (2016 to 2026): 17 months less
Minimum wage
- 2026 annualized minimum wage: $15,080
- Time needed to save at annualized minimum wage (2026): 28.5 years
* States are ranked by the change in time needed to save for a home down payment at the median household income.
Methodology
The typical home value in each state in April 2016 and April 2026 was sourced from Zillow’s Home Value Index for all homes. Median household income for each state in 2016 was sourced from the U.S. Census Bureau’s American Community Survey one-year estimates. For 2026, median household income was estimated by adjusting each state’s 2024 ACS one-year median household income by national growth in the Employment Cost Index for private-industry wages and salaries from the 2024 annual average through the first quarter of 2026. Time needed to save for a home down payment was calculated as a point-in-time affordability estimate, using the typical home value and estimated household income in each respective year. The calculation assumes a 20% down payment and annual savings equal to 10% of income, and does not model investment returns or changes in income over the course of a household’s saving period. For minimum-wage workers, annual income was calculated using each state’s 2026 minimum wage, as recorded by the U.S. Department of Labor, multiplied by 2,080 hours. Source data providers are not affiliated with, and do not endorse or sponsor, this study or its findings.
This story was produced by SmartAsset and reviewed and distributed by Stacker.