


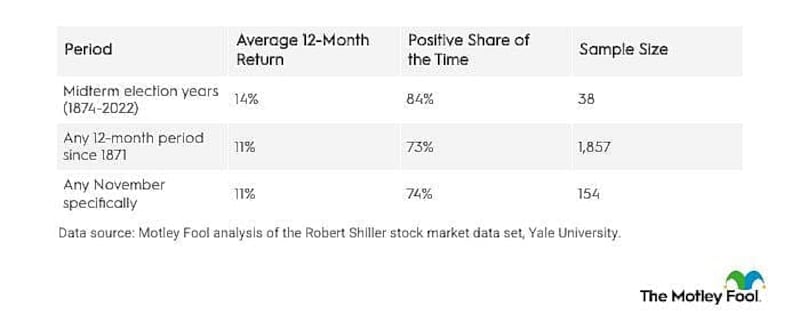
Since 1874, the S&P 500 has climbed in the year following 32 of the last 38 midterm elections, gaining an average of 14%, according to a Motley Fool analysis of election-year stock market history.
Neither how many seats the president's party loses in Congress nor which party ends up running Washington afterward has been closely tied to the S&P 500's return in the following year, according to a Motley Fool analysis of Robert Shiller's stock market data set, official U.S. House of Representatives election results, and U.S. Senate Historical Office Party Division records.
The historical record of stock market performance after midterm elections strengthens the case for long-term investing based on company fundamentals. It also suggests that trading on election odds or results, the way gamblers do on prediction markets like Kalshi, isn't a sound strategy.
Below, The Motley Fool looks at how the stock market has performed before and after every midterm election since 1874.
Midterm-year stock market history vs. the long-run average
Midterm-year returns have modestly outpaced the stock market's long-run average return, whether measured against any 12-month period since 1871 or against any November specifically.
The Motley Fool
About 150 million Americans own stock, either through a brokerage account or, for most, through a retirement account, according to Motley Fool research. How the market behaves around a midterm election and how investors react to it affect portfolios and retirement funds across the country. It isn't just a concern for hedge funds and Wall Street traders.
Stock market returns before the midterm elections
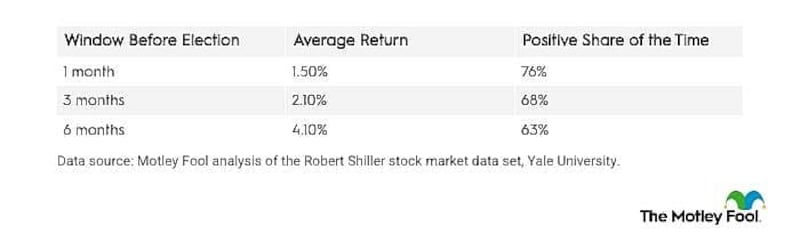
The S&P 500 typically drifts slightly higher before a midterm election. The market has averaged a gain of 4% in the six months before a midterm and 1.5% in the month before Election Day, with positive returns 63% and 76% of the time over those two windows.
The Motley Fool
Stock market returns after midterm elections
Once the votes are counted, the market cools off, and the following month is more muted than the previous one.
The S&P 500 has averaged a gain of just 0.5% in the month after a midterm, positive only 55% of the time, compared with a 1.5% average and 76% positive rate in the month before.
Bigger gains have historically shown up later: a 6% average gain three months after a midterm and a 10% average increase six months after, positive 76% and 87% of the time over those windows.
Across all 38 midterms since 1874, the S&P 500 has gained an average of 14% in the 12 months after Election Day and finished higher 84% of the time, according to the Motley Fool analysis.

The Motley Fool
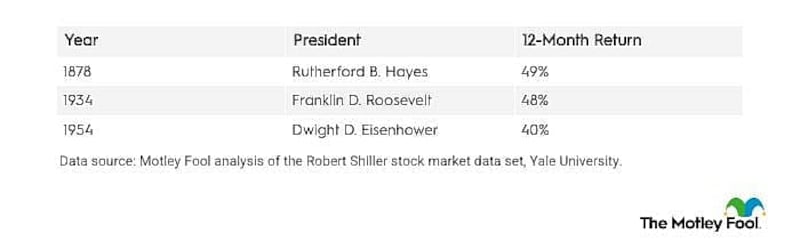
Best markets in the 12 months after a midterm election since 1874
The Motley Fool
The market has risen sharply in the 12 months after a midterm election in a few standout cases, with little to no bearing on the election results themselves.
- The 1878 rally followed the recovery from the Panic of 1873.
- The 1934 rally followed the Great Depression's 1932-33 market bottom.
- The 1954 gain rode the postwar expansion that followed the Korean War.
Worst markets in the 12 months after a midterm election since 1874

The Motley Fool
Similarly, the market has dropped sharply after a handful of midterm elections, again tied more to historical circumstances than to the election outcomes themselves.
- The 1906 decline came just before the Panic of 1907.
- The 1930 decline landed in the early years of the Great Depression.
- The 1902 decline coincided with a broader economic slowdown.
Swings like these are a reminder that bull and bear markets show up on their own schedule, midterms or not.
Stock market returns under unified and divided government, by party
Which party runs Washington afterward and how the branches of government are divided have influenced stock market returns in the 12 months following a midterm election, though not in a straightforward way.
Divided government, where the House, the Senate, or both are controlled by a party other than the president's, has averaged stronger returns than unified government, where one party controls both legislative chambers and the White House.

The Motley Fool
Splitting unified and divided government by party changes the picture.

The Motley Fool
A unified Democratic government has had the strongest average return of the four groups, though it is based on just eight midterm elections, spanning the Wilson to Carter administrations.
A divided government under a Democratic president has resulted from nine midterm elections dating back to the 1880s, and the market has been positive in the 12 months following eight of them.
A divided government under a Republican president followed 14 midterm elections — the most of the four outcomes — and the market was positive 93% of the time in the 12 months after those contests.
A unified Republican government is the one arrangement that averaged a negative return in the 12 months after a midterm election. The sample is the smallest, however, and three of the seven years immediately after a midterm election resulting in that arrangement, including 1902, 1906, and 1930, were the lead-up to financial panics that had little to do with which party held Congress.
Stock market returns by the size of the president's party's congressional losses
How many seats the president's party loses in the House or Senate in a midterm election has shown little relationship to market movements afterward.

The Motley Fool
In both chambers, a landslide loss has not been followed by weaker returns than a narrow one in the twelve months after the midterm. The relationship between seat losses and next-year returns is weak in the House, and about as weak in the Senate.
Historically, voters who banked on significant political change to improve their investment returns may have been disappointed.
How should investors think about midterm elections and the stock market?
Since 1874, the S&P 500 has tended to rise in the year after a midterm election more than its average annual return, and that has held up regardless of which party won, how many seats changed hands, or who ended up in charge of Washington afterward.
That should provide comfort to investors. While midterm elections make political headlines and their outcomes can generate angst and uncertainty, the data show they generally do not cause wild market swings once the dust has settled.
Investors deciding what to do with that pattern can look past attention-grabbing political news and feel confident researching stocks to buy and hold for the long run.
FAQs
Does the stock market always rise after a midterm election?
No, but it usually has. The S&P 500 rose in the 12 months after 32 of the 38 midterm elections since 1874, or 84% of the time, according to a Motley Fool analysis of Robert Shiller's stock market data set.
What is the average S&P 500 return in the year after a midterm election?
The S&P 500 has averaged a 14% total return in the 12 months after a midterm election since 1874, compared with an 11% average for any 12-month period in the market's history.
Does the stock market drop before a midterm election?
Not typically. The S&P 500 has averaged a gain of 1.5% in the month before a midterm and posted a positive return 76% of the time, though gains have historically picked up after the election rather than before it.
Does which party controls Congress after a midterm election affect the stock market?
Somewhat. Under a Republican president, a Congress fully controlled by Republicans is the one arrangement where returns have historically been weak, though it rests on only seven elections, three of which directly preceded financial panics.
Do landslide midterm elections hurt stock returns more than close ones?
No. Since 1874, midterms in which the president's party lost 40 or more House seats have averaged returns similar to those of midterms with smaller losses.
Methodology
This Motley Fool analysis is based on Robert Shiller's monthly U.S. stock market data set, which tracks S&P 500 prices, dividends, and inflation back to 1871. Returns are total return, meaning stock price gains plus dividends, not adjusted for inflation, measured from the November reading of each midterm election year. Because the underlying data is monthly, the November figure is a monthly average, not an election-day closing price.
House seat and control figures come from official U.S. House of Representatives election results dating back to 1856. Senate seats and control figures come from the U.S. Senate Historical Office's official Party Division records, which compare the Congress seated immediately before and after each midterm.
Other research on this topic sometimes reports different numbers from those in this article. That is usually a difference in method, not a disagreement with a general trend. Some studies count only price gains, excluding dividends. Some measure a calendar year or a specific year in the four-year presidential cycle, rather than the 12 months immediately after a midterm election. Some start their data in 1950 rather than 1874. Some use the Dow Jones Industrial Average instead of the S&P 500. And some average returns across every year under a given party arrangement, rather than just the months right after a midterm.
This story was produced by The Motley Fool and reviewed and distributed by Stacker.